Lithium-ion batteries have quickly become ubiquitous in our everyday lives. Stephan Woods of Thermo Fisher Scientific explores the role of spectroscopy in this development.
There is constant demand for higher energy densities, faster charging and smaller battery sizes, driving the rapid development of alternative electrode materials. For example, all lithium salts have their limitations; LiPF₆ generates corrosive hydrogen fluoride in the presence of moisture, LiAsF₆ is toxic, LiSO₃CF₃ has low ionic conductivity, and LiBF₄ forms high resistivity barriers at the electrode surfaces.
These negative traits highlight the need to develop new electrode materials with improved functionality and stability.
Any changes in battery design must be thoroughly characterised and tested under operating conditions before they can be included in commercial products – a process that can be extremely time consuming and expensive. Another barrier to progress is the fact that many existing analytical technologies require highly skilled personnel to interpret the results, limiting the pool of operators qualified to run analyses. This hinders productivity and slows the rate at which novel battery components can be developed and released for commercial manufacture.
Cutting-edge analytical technologies
Fortunately, modern vibrational spectroscopy solutions – such as Raman instruments – are capable of identifying everything from compositional changes and crystallisation to ionic dispersion and electrolyte degradation within lithium-ion batteries. They can be applied throughout research and development, production and quality control.
Raman spectroscopy uses the interactions of light and molecular vibrations to produce spectra that are used to identify materials, characterise molecular structures, evaluate morphologies and monitor dynamic processes.
It can be applied for the analysis of many different types of battery components, including cathode materials, anode materials and electrolytes. Raman imaging is a viable alternative to traditional single-point measurement techniques, enabling users to quickly make thousands of measurements over an area of the component. Each pixel is a complete Raman spectrum, so the operator can tell if changes are heterogeneous or just hot spots, and this data can be correlated with electrochemical performance. Raman technology is non-destructive and fast – often providing measurements at intervals of 30 seconds or less. It requires minimal sample preparation and can be used both in situ and ex situ. (Panel 1)
Raman spectroscopy for ex situ characterisation of lithium-ion battery anodes

Anode samples from a disassembled lithium-ion battery were cut and mounted in a transfer cell (Fig 1) so that a cross-section of the anode could be imaged. A 90° stub was used to hold the cut edge of the anode facing the window. A cap containing a CaF2 window was used to seal the sample under an argon blanket, which was screwed on until the window height was just above the sample. This provided a minimum working distance between the microscope objective and the sample, allowing the use of high magnification objectives having a large numerical aperture.
Raman spectra were collected over a single 76μm x 160μm area at a spatial resolution of 1.0μm per pixel using a Raman imaging microscope. Laser power at the sample was 2.0mW at 532nm, with a 0.2-second exposure time and four spectral scans per image. A 50 x long working distance, 0.5 NA microscope objective was used to focus through the transfer cell window.

Image contrast was generated by multivariate curve resolution analysis to find the major components within each image, and a different colour was assigned to each component. Multiple regions of the sample were imaged and the Raman spectral data within each region was averaged to produce a single spectrum, homogenising any differences in the electrode area. This average spectrum represented a single-point measurement, with each point representing a 30μm square compared to a typical 1μm sample area represented by a standard Raman microscope.
Fig 2 is a micrograph of the anode cross-section, superimposed with the Raman image created from the spectral differences shown by the inset Raman spectra. The Raman image clearly shows that the coating on one side of the copper current collector is dominated by carbon black (red), whereas the other side has a much greater density of the active graphite phase (blue). The major differences in the two coatings could easily have been missed by single-point measurements.
In situ analysis provides valuable information supporting the research and development of new electrode materials. For instance, Raman instruments can be used in situ to map spatial and temporal changes in anode composition – such as the distribution of different phases of the same material with different performance characteristics – and to map anode degradation and compositional changes throughout charge and discharge cycles.
This is helpful in the investigation of lithiation, where the interaction of positively charged Li+ ions with the anode causes a swelling of the graphitic structure, irreversibly damaging the anode and significantly reducing battery lifetime. (Panel 2)
Raman spectroscopy for the in situ characterisation of lithium-ion battery electrodes

Electrode material – graphite powder – was spread onto a copper grid, serving as the current collector. This was then sandwiched between a glassfibre separator soaked with the electrolyte solution and lithium metal as the counter electrode (CE) from below, and a sapphire (Al2O3) window from above. The Raman beam from the Raman imaging microscope objective impinged onto the back side of the material through a sapphire (Al2O3) window (Fig 3).
This minimised the pathway for the Raman beam, allowing the use of high magnification objectives and optimising spectra quality. The electrode was charged very slowly to minimise the gradient of lithiation concentration along the depth of the electrode. The graphite electrode was cycled at a constant rate of approximately 0.06C, corresponding to 33 hours for a full charge/discharge cycle between 1.5 and 0.005V against Li/Li+.
Raman imaging was carried out during the initial 480 minutes of the charging (lithiation) process only. Raman spectra were collected over a 30μm × 30μm area at 1μm pixel spacing using 2mW of 532nm laser excitation, a 0.01-second exposure time for each pixel, and 50 scans per image. Higher laser powers and/or longer exposure times resulted in burning of the graphite and boiling of the electrolyte.
Changes in the Raman spectrum

In Fig 4, the 3D view (bottom left) shows changes in the Raman spectrum as a function of time over 8.3 hours (1–500 min). The spectrum of graphite exhibits a prominent peak at 1580cm-1, attributed to the E2g2 mode (G band). At potentials between 0.42 and 0.31V (specific charge 33 and 45mAh/g), the band gradually disappears along with the simultaneous emergence of a peak centred at 1590cm-1.
This peak shift was attributed to the Li+ ions intercalated into the graphite structure. This is more easily seen in the centre, 2D Raman image. The inset shows Raman spectra before and after the change. Towards the end of the charge cycle at 8.3 hours (496 min), where the voltage was less than 0.15V (specific charge greater than 146mAh/g), a strong Raman band centred at 154cm-1 begins to appear.

This Raman band had not been previously reported so its assignment was not conclusive; strong Raman bands in this region have been attributed to TiO2, Sb, and metal chlorides. In Fig 5, Raman images are presented in which the image contrast was generated by MCR analysis. The blue MCR component is indicative of the 1580cm-1 band; green, the 1590cm-1 band; and yellow, the 154cm-1 band, with red representing carbon black. This experiment demonstrated that in situ Raman imaging techniques effectively show the spatial distribution of phase changes in electrodes over time.
Recently, other allotropes of carbon besides graphite have been investigated for anode materials, due to their novel physical and chemical properties. Raman spectroscopy is an excellent choice for analysing the presence, molecular structure and quality of different carbon allotropes, including in hybrid materials.
For example, Raman spectral data can be used to determine the number of sheets of graphene in a stack, provide information on defects or disorder in the structure, as well as to determine diameters of single-wall carbon nanotubes. Raman spectroscopy can also be used to study the degree of association of electrolyte ions in both solutions and polymer materials – which directly affect battery performance – to characterise electrolyte additives designed to partially immobilise the anions and improve cation charge transfer, and to study of membrane component distribution. (Panel 3)
Raman analysis of lithium-ion battery electrolytes
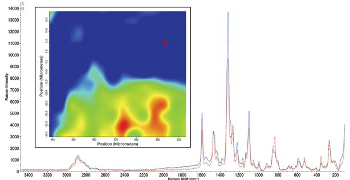
Raman spectroscopy was used to characterise the additives and electrolytes in the polymer membranes and to study the distribution of the components within the membranes prior to use in an active battery cell. Raman mapping of the polymeric materials using a dispersive Raman spectrometer with a motorised stage and a 780 nm laser provided images based on the Raman spectra that showed the spatial distribution of the additives and electrolytes in the polymer membranes.
Fig 6 shows the spatial distribution of the supramolecular additive, 5,11,17,23-tetra-p-tert-butyl-25,27-bis(((N-pnitrophenylureido) butyl) oxy)-26,28-dipropoxycalix[4]arene (Cx2), in a poly(ethylene oxide) (PEO) matrix ex situ. The image is based on the ratio of a peak from the supramolecular additive (1598 cm-1) to a peak associated with the PEO (840 cm-1).3 The red colour indicates a higher concentration of additive and the blue, a lower concentration. Representative spectra from each of the areas are displayed as well.
Turning to manufacturing, Raman spectroscopy is a valuable tool for assessing the metal oxide and lithium compounds in raw materials, as well as for identifying any contaminants before beginning the manufacturing process. With available material libraries, Raman instruments can automatically detect these elements and quickly indicate if the desired compounds are present or not, and whether the material fits within pre-set tolerances.
This prevents bottlenecks in raw material quality control and enables real-time process modifications later on, helping to avoid coating and discarding unsuitable goods, ultimately reducing financial losses. Raman spectroscopy can then be used in post-production quality control to profile individual battery components without missing variability across an area, consolidating measurements of a cross-section to flag up inconsistencies and defects before commercialisation or assembly of a finished battery.
A solid-electrolyte interphase (SEI) layer forms on the battery anode as a by-product of the charge and discharge process. It is key to battery performance as it stabilises the electrode by preventing further decomposition, and also promotes reversible capacity. In situ Raman spectroscopy can be used to monitor and characterise the formation of the SEI layer, contributing to knowledge about its impact on lithium-ion battery function.
Complementary techniques for comprehensive insights
Fourier transform infrared (FTIR) spectroscopy is another technology being increasingly employed for numerous applications in battery research and manufacturing, and provides molecular information that is complementary in nature to Raman.
Its non-destructive nature makes this an ideal technique for examining the behaviour of different regions of energy storage cells in situ, aiding the rapid identification of changes that could affect battery life and safety. It can also be applied during raw material quality control to assess incoming goods, and is widely used for ex situ characterisation of lithium salts, electrolyte formulations, and catalytic systems.
FTIR again comes into play during final product quality control, helping to confirm that regulatory and stakeholder specifications have been met. The technology is also an important tool for analysing gaseous emissions released during battery operation under different environmental conditions, forming an early warning system before other visible signs of damage appear. This helps to establish the susceptibility of the battery to damage by overheating, overvoltage and mechanical damage, informing the development of safer, more resilient products.
Removing barriers with a new class of technology
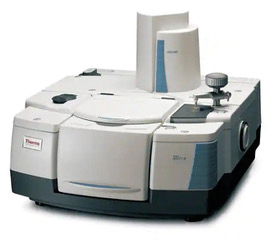
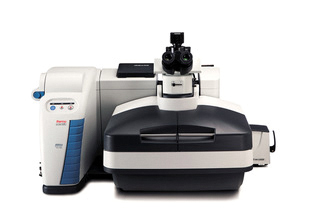
State-of-the-art Raman and FTIR analysers are becoming increasingly intuitive and user friendly, while still offering high performance, removing many of the obstacles that have historically made routine use of these spectroscopy techniques arduous for individuals with limited expertise or specific technical knowledge. This is allowing a greater number of operators to quickly become confident in using Raman and FTIR instruments in daily workflows, lightening the workload on more experienced team members and helping to speed up analyses for increased plant throughput.
These highly sensitive technologies are more accessible than ever before, and greatly streamline battery development and production, offering unparalleled insights into the performance of novel materials and enabling the early detection of more defects during manufacturing.
This reduces both material wastage and financial losses for the manufacturer, and improves product robustness and regulatory compliance. The latest generation of Raman and FTIR instrumentation is playing a huge role in accelerating the design and commercialisation of new lithium-ion batteries with increased storage capacities, lifetimes and safety, both satisfying consumer demands and paving the way towards a more sustainable future.


